
Loading article
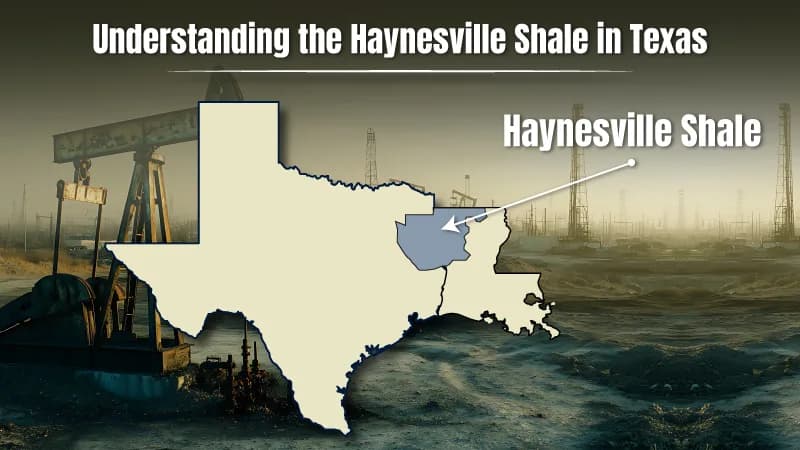
The Haynesville Shale has spread over a large area of Texas, making substantial contributions to shaping the energy outlook of the United States. This shale, with its high potential minerals and rich geological formations, has attracted the attention of several energy companies and investors.
With global energy demand on the rise, understanding the Haynesville Shale is more vital than ever. This comprehensive draft will assist you in understanding the Haynesville Shale in Texas oil and gas more sophisticatedly.
If you are an experienced investor or looking to invest in the mineral sector, understanding the intricacies of Haynesville Shale is crucial. Factors like its historical background, geological features, and economic impact contribute to its value.
Let’s first explore the basics of Haynesville Shale in Texas!
Popularly known as the Haynesville Shale, the Jurassic Period rock formation underlies most of southwestern Arkansas, northwest Louisiana, and East Texas.
The Haynesville Shale, one of the most high-potential mineral-containing rock formations, has spread in the vast lands of the Eastern Region of Texas, the Northwestern Part of Louisiana, and the Southwestern Area of Arkansas. It holds a depth of approximately 10,500 to 13,000 feet below the surface of the earth. This shale is a large rock formation recognized by geologists as the Haynesville Formation.
The Haynesville Shale comprises a surface of around 9000 square miles with 200 to 300 feet of thickness. The sandstone of the Cotton Valley group covers the entire Haynesville Shale and is reinforced by the limestone of the Smackover Formation.
This shale consists of vast reserves of recoverable natural gas, which is also known as ‘Shale Gas’. The wells in this shale are produced from lower permeability mudstones, which are a rich source of natural gas. This is the reason this shale holds large quantities of natural gas.
In the early days, according to geological surveys and journal papers, Haynesville Shale used to be considered part of Bossier Shale, although both shales are now divided as two different formations. Let us know more about the historical background of Haynesville Shale.
Let us understand the detailed history of Haynesville Shale through a proper timeline.
Jurassic Era: The formation of black and organic-rich Haynesville Shale started forming.
Early 1900s: The formation beneath the land was not uncovered.
Post 1950: Source rock was observed in this formation.
Before 2008: Haynesville Shale was considered a source rock due to its low permeability. It was usually identified to carry large amounts of natural gas.
2008: This formation was officially considered a massive dry natural gas, the Haynesville Shale.
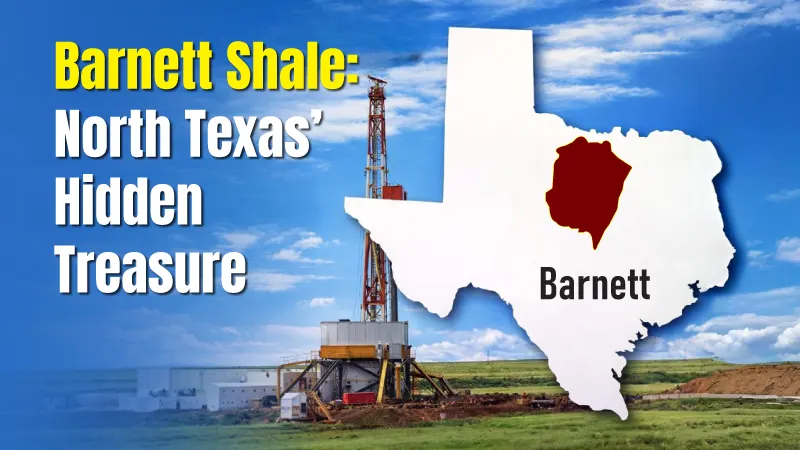
2008: Geoscientists and drillers decided to implement hydraulic fracturing and Horizontal drilling in the Haynesville Shale. Before this, these technologies were utilized earlier in the Barnett Shale field in the North Region of Texas.
2008 Onwards: Horizontal drilling and hydraulic fracturing enabled the shale to produce the maximum amount of natural gas.
2009: Implementing these technologies made this shale known as one of the major natural gas reservoirs in the US.
2009 to 2010: The immense development and drilling undertakings occurred in the Haynesville Shale, achieving the significant production of natural gas.
2010: The major rise in drilling initiatives took place, with nearly 190 drilling rigs operating in the shale.
2010 Onwards: The sudden fall in the prices of natural gas resulted in the reduction of drilling practices in the shale.
2011-2012: Due to a drop in natural gas prices, fewer wells were drilled, and several completed wells were shut in.
Post 2012: The drilling operation again slightly rose in the shale due to increased prices of natural gas in the global market.
2013: The drilling rig count exceeded 38 rigs.
2013-2023: This shale recorded noticeable natural gas production outcomes.
2024: It became the second largest formation containing a significant amount of natural gas in the US after the Marcellus Shale.
If the prices of natural gas remain stable or increase, drilling will continue in the shale, as geologists and mineralogists believe, with an estimated 75% of natural gas reservoirs yet to be developed beneath the surface.
This timeline demonstrates the crucial stages and developments in the past and current scenario of the Haynesville Shale, highlighting its evolution from a major source rock to a potential natural gas formation. The shale’s geology also contributes to enhancing its landscape.
Haynesville Shale covers a large area between the Cotton Valley Group and the Smackover Formation. It holds massive deposits of dry natural gas. Due to its rich organic content, it is said to be the source rock. It is also known as reservoir rock because it possesses sufficient permeability and porosity to efficiently store and transfer hydrocarbons.
This shale formation is the black and potentially organic shale, which is considered the upper member of the Louark Group. This entire formation is classified into upper and lower members. The lower members of this shale are assumed to be the primary interest of the industry. In the eastern region of Texas, the lower member is approximately 300-350 feet thick, whereas it has approximately 200-250 in thickness in the Northwestern zone of Louisiana.
This shale produces natural gas from a depth of around 10000 feet beneath the earth. With substantial deposits in the following counties, this shale spans over 3 million acres.
| Gregg County, Texas |
| Harrison County, Texas |
| Marion County, Texas |
| Panola County, Texas |
| Shelby County, Texas |
| Rusk County, Texas |
| Upshur County, Texas |
The table below gives a comprehensive overview of the number of drilling permits issued by the government in Haynesville Shale from 2008. Industry stakeholders must understand these shifts to analyze the regulatory framework and its influence on drilling operations.
| Year | Number of Permits Issued |
|---|---|
| 2008 | 121 |
| 2009 | 165 |
| 2010 | 341 |
| 2011 | 257 |
| 2012 | 124 |
| 2013 | 88 |
| 2014 | 110 |
| 2015 | 59 |
| 2016 | 44 |
| 2017 | 125 |
| 2018 | 197 |
| 2019 | 166 |
| 2020 | 132 |
| 2021 | 171 |
| 2022 | 278 |
| 2023 | 210 |
| 2024 | 47 |
Haynesville Shale in Texas has attracted prominent energy companies. Some of the top companies that have shown their interest in Haynesville Shale are listed below.
| Anadarko Petroleum | Berry Petroleum | Cabot Oil and Gas | Chesapeake Energy |
| Comstock Resources | Crimson Exploration | Cubic Energy | Devon Energy |
| Eagle Oil | El Paso Corp. | EnCana Corp. | EOG Resources |
| EXCO Resources | Forest Oil | GMX Resources | Goodrich Petroleum |
| NFR Energy | Noble Energy | Penn Virginia | Petrohawk |
| Plains Exploration and Production | Questar Corp. | Shell Western | St. Mary Land & Exploration |
| SM Energy | Sojitz Energy | Southwestern Energy | XTO Energy |
Operators manage leases for Haynesville Shale mineral rights and contribute to gas production remarkably. The table below indicates the names of the top ten operators in the shale, along with the lease count and gas volume.
| Operator Name | Lease Count | Gas Volume (MCF) |
|---|---|---|
| ROCKCLIFF ENERGY OPERATING LLC | 274 | 415,313,510 |
| AETHON ENERGY OPERATING LLC | 246 | 334,697,844 |
| COMSTOCK OIL & GAS, LLC | 268 | 192,665,683 |
| SABINE OIL & GAS CORPORATION | 155 | 163,921,890 |
| XTO ENERGY INC. | 323 | 109,439,483 |
| R. LACY SERVICES, LTD. | 38 | 62,867,828 |
| BPX OPERATING COMPANY | 91 | 46,029,822 |
| SILVER HILL ENERGY OPERATING LLC | 41 | 32,319,427 |
| PINE WAVE ENERGY PARTNERS OP, LLC | 13 | 30,983,533 |
| TGNR EAST TEXAS LLC | 226 | 25,993,162 |
The below table shows the production data of 2024 (We will try uploading the latest production data soon. Stay connected.)
| Oil and gas production in Haynesville Shale for 2024 | |
|---|---|
| Month | PR Gas Production Volume (MCF) |
| January | 128,816,268 |
| February | 114,771,035 |
| March | 113,563,548 |
| April | - |
| May | - |
| June | - |
Haynesville Shale continues to evolve as producers adjust their strategies in response to market dynamics. While some operators are pacing their drilling and production activities, this shift often leads to more focused and efficient development.
For mineral owners and investors, these periods of adjustment can present valuable opportunities—whether it's stronger positioning for future leases, better alignment with high-performing operators, or long-term growth potential as new strategies take shape.
According to Mineralogists, Haynesville gas production may demonstrate positive results in the forthcoming years.
Disclaimer: The figures related to drilling permits, lease counts, gas volumes, and production values are sourced from reputable industry databases. Please note that these values may vary slightly across different platforms. Users are encouraged to interpret the data with this in mind.
Haynesville Shale has become the second-largest gas formation in the United States, captivating several investors and operators to invest here. It plays a vital role in reshaping the energy industry's perspective.
This extensive formation of natural gas drastically influenced regional as well as national energy markets. For energy experts and new investors, staying informed about the next production step of Haynesville Shale will help them achieve positive returns.
Not only is this shale play producing minerals nicely, but so are others in the Permian Basin, Barnett Shale, and Eagle Ford Shale. Mineral View makes it easy to see all of the counties' production statistics, well data, and other related information in just one click.
The Haynesville Shale is located in the vast lands of the Eastern Region in Texas, Northwestern Part of Louisiana and Southwestern Area of Arkansas.
The Haynesville Formation has depths of approximately 10,500 feet to 13,500 feet beneath the surface of the earth.
Informational only — not legal, tax, or investment advice.