"Every producing well tells a story, but only if you know how to read it."
For Texas mineral owners, that story is written through oil and gas production forecasting. It determines how production declines, how long a well will generate revenue, and ultimately how valuable that asset becomes over time. While production numbers are publicly available through the Texas Railroad Commission and broader energy trends are tracked by the U.S. Energy Information Administration, the real challenge lies in interpretation.
Forecasting is where raw data turns into insight. It bridges the gap between what a well has produced and what it is likely to produce in the future.
For mineral owners, understanding this process is not about becoming an engineer; it is about gaining clarity on royalties, leases, and long-term ownership decisions.
Let’s first understand what production forecasting actually means.
What Production Forecasting Actually Means
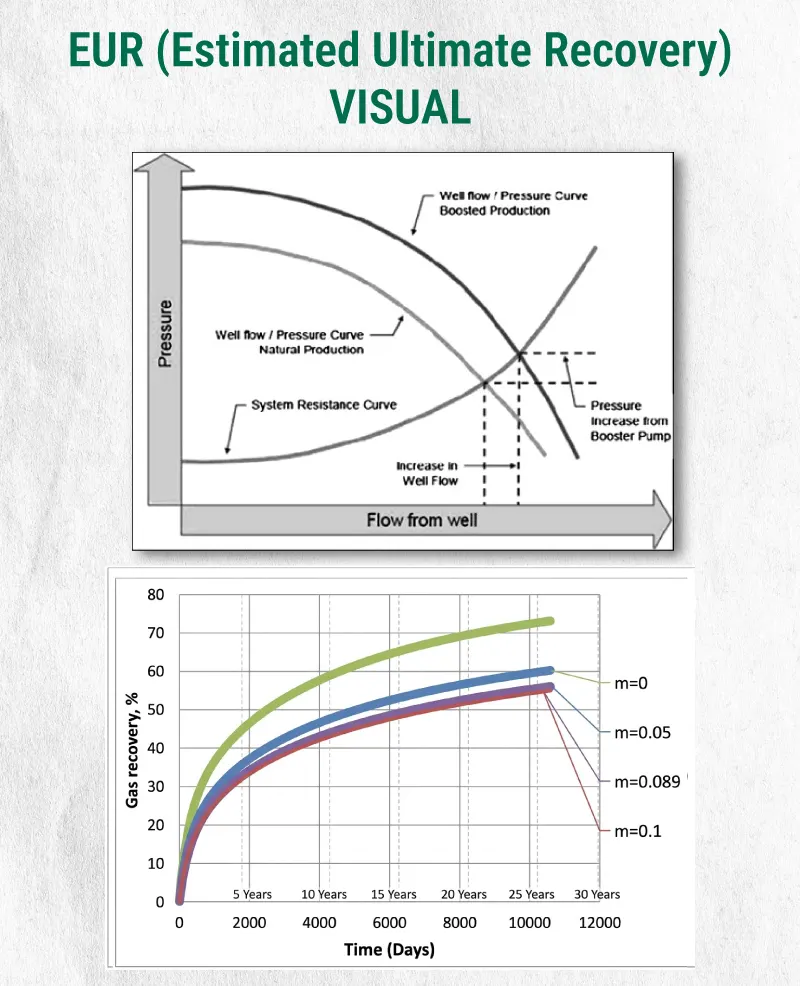
The "m" in the graph above represents the Water Drive Index, which simply measures how much underground water is pushing into the gas reservoir as you pump the gas out.
Oil and gas production forecasting is the analytical process used to estimate a well's future output based on historical flow rates and reservoir pressure. In Texas, it determines the Estimated Ultimate Recovery (EUR), which helps mineral owners predict royalty income, evaluate lease expirations, and assess long-term asset value. It is not a fixed prediction. Instead, it is a structured estimate built on data, engineering models, and assumptions about how the reservoir will behave over time.
Every forecast ultimately aims to answer one core question: how much will this well produce over its lifetime? This is commonly expressed as EUR, which represents the total recoverable volume from a well.
To reach that estimate, engineers analyze a combination of factors, including production history, pressure behavior, and fluid movement within the reservoir. In Texas, where geological conditions vary widely, forecasting methods must adapt to different types of wells, from conventional vertical wells to modern horizontal shale operations.
How Forecasting Is Performed in Texas Operations
For mineral owners, forecasting may sound complex, but behind the scenes it follows a structured process based on production data and field conditions. Here are the primary methods and data inputs commonly used to build and refine production forecasts across Texas operations.
Production Data Collection as the Foundation
The forecasting process begins with detailed production data. Operators gather information on flow rates, pressures, and fluid composition, which is then reported to the Texas Railroad Commission. Under the comprehensive 2025 rule overhaul (Chapters 3 & 4), operators must now also register 'reserve pits' and adhere to stricter groundwater protection standards. For mineral owners, these new environmental compliance costs can impact the 'net' deductions seen on royalty statements.
Decline Curve Analysis for Trend Estimation
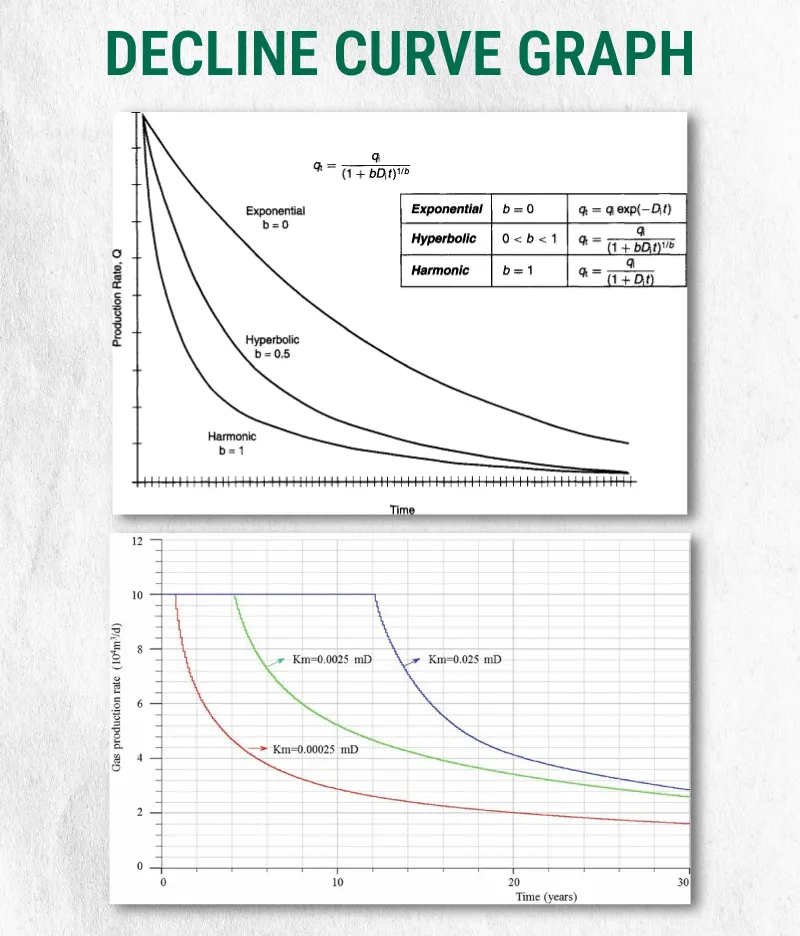
One of the most widely used methods is decline curve analysis, where engineers study how production decreases over time and analyze how production declines over time and use that pattern to estimate future output. The most common decline patterns include different patterns that show how production declines over time, each representing different reservoir characteristics and production behaviors.
Type Curve Application in Unconventional Plays
In the Permian Basin of 2026, which now produces a record 6.6 million b/d, forecasting has shifted toward 'Refracturing' and 'Enhanced Oil Recovery (EOR).' Because most Tier-1 acreage is already drilled, engineers now focus on 'stacked pay' zones and secondary formations to maintain the basin's plateau.
Reservoir Simulation for Complex Fields
For reservoirs with more complex geological structures, advanced models are used to better understand how oil and gas move underground and how production may change over time. These models incorporate how easily oil and gas can flow through the rock, providing a more detailed and scenario-based understanding of long-term production behavior.
Machine Learning and Data-Driven Enhancements
Advanced forecasting increasingly includes data-driven techniques. Machine learning models analyze large datasets across thousands of wells to identify patterns and improve forecast accuracy. While these approaches enhance traditional methods, their effectiveness still depends on the quality and completeness of the underlying data.
Why Forecasts Do Not Always Match Reality
Even the most advanced models cannot fully capture the dynamic nature of reservoirs and field operations. The following factors explain why actual production often differs from forecasted expectations over time.
Reservoir Behavior Is Constantly Changing
Reservoirs are not static systems. As pressure declines and fluids move within the formation, production behavior evolves, making it difficult for any model to remain perfectly accurate over time.
Forecasts Represent Ranges, Not Certainties
Oil and gas production forecasting should always be interpreted as a range of possible outcomes rather than a fixed prediction. Variability is inherent in all reservoir systems.
Operational Decisions Impact Production Trends
Field-level decisions can significantly alter production. Installing artificial lift systems may temporarily stabilize or increase output, while refracturing operations can change long-term decline behavior. These interventions are not always predictable at the time of initial forecasting.
Well Interference and Field Development Effects
Drilling additional wells in close proximity can create interference between wells. This interaction can reduce reservoir pressure and impact production rates in ways that were not originally anticipated.
Market Conditions Influence Production Strategy
Production is not driven solely by reservoir performance. While operators may shut in wells during price troughs, the 2026 market is defined by high volatility and a geopolitical 'war premium,' with WTI trading between $92 and $100. Currently, the risk is not low prices but 'infrastructure bottlenecks' and 'capital discipline,' where operators prioritize cash flow over aggressive new drilling.
Forecasts Evolve with New Data
Forecasts are continuously refined as new production data becomes available. While accuracy improves over time, forecasts are never final and should always be viewed as evolving tools rather than definitive answers.
Common Misconceptions Mineral Owners Should Avoid
Misunderstandings around oil and gas production forecasting often lead to unrealistic expectations and poor decision-making. Recognizing these common misconceptions helps mineral owners interpret forecasts more accurately and use them more effectively.
Forecasts Do Not Represent Royalty Income
A common misunderstanding is assuming that a forecast directly reflects future royalty payments. In reality, oil and gas production forecasting estimates production volumes only. Actual royalties depend on additional factors such as commodity prices, lease terms, and applicable deductions.
High Initial Production Does Not Guarantee Long-Term Value
Strong early production can create a false sense of long-term performance. Many wells, particularly in shale formations, experience steep decline rates after initial output. Long-term value is determined by decline behavior rather than initial production levels.
Forecasts Are Not Static Documents
Another misconception is treating forecasts as fixed projections. In practice, oil and gas production forecasting is continuously updated as new production data becomes available. A forecast developed early in a well’s life may change significantly over time.
Production Trends Require Context for Proper Interpretation
Without understanding how forecasts evolve, mineral owners may misinterpret short-term performance changes. Viewing production data in isolation, without considering broader forecasting updates, can lead to incomplete or incorrect conclusions.
Mineral owners should also note Texas HB 9 (effective Jan 1, 2026), which increased the property tax exemption for income-producing tangible personal property to $125,000. While this primarily benefits operators, it alters the economic threshold for when a marginal well becomes 'uneconomic' to keep producing.
How Forecasting Influences Royalties and Lease Decisions
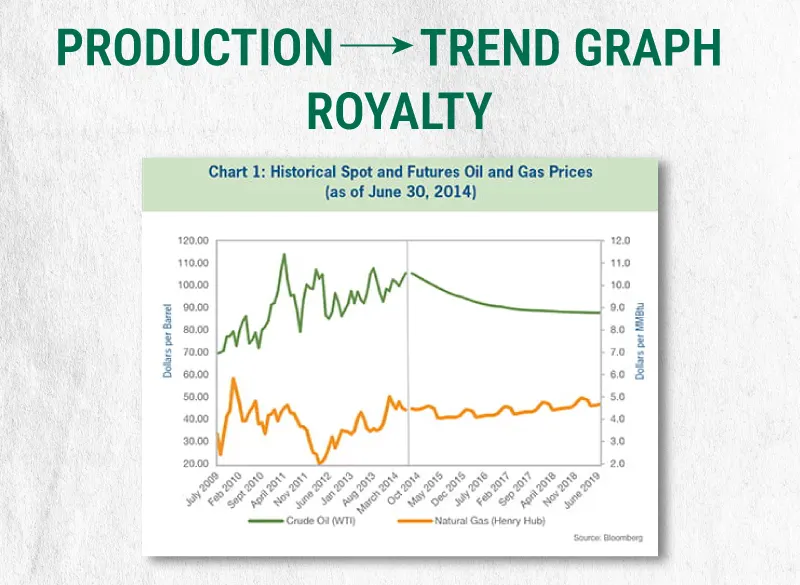
The financial impact of oil and gas production forecasting becomes most visible in royalty income. Since royalties are tied directly to production, any change in production trends will affect the payments received over time.
Rather than expecting a steady income stream, mineral owners should anticipate a decline pattern. Forecasting helps you understand how your royalty income may decline over time and what to expect in the years ahead.
Lease agreements are also closely tied to production behavior. Many leases depend on continuous production to remain active. Forecasting helps determine whether a well is likely to sustain production long enough to hold the lease or whether renegotiation opportunities may arise.
From a broader perspective, forecasting supports long-term ownership decisions. Whether evaluating a buyout offer or planning to retain mineral rights, having a clear understanding of expected production allows for more informed choices.
Where Mineral Owners Commonly Go Wrong
Misinterpreting production data and oil and gas production forecasting can lead to avoidable financial and strategic mistakes. The following are some of the most common errors mineral owners make when evaluating well performance.
Overemphasis on Early Production Results
One of the most frequent mistakes is focusing too heavily on initial production rates. While early output may appear strong, long-term value is determined by decline trends, which often reduce production significantly over time.
Reliance on Incomplete or Outdated Data
Forecast accuracy depends directly on data quality. When mineral owners rely on delayed or incomplete production data, projections can become distorted, making it difficult to assess actual well performance.
Ignoring Operational Interventions
Activities such as workovers, recompletions, and artificial lift installations can temporarily change production behavior. Without recognizing these interventions, short-term increases or fluctuations may be incorrectly interpreted as long-term trends.
Evaluating Wells in Isolation
Wells are part of broader field development strategies. Nearby drilling activity and well interference can influence production in ways that are not immediately visible when analyzing a single well independently.
In practice, this is where forward-looking tools become valuable. For example, using an estimate that projects how a mineral asset may perform over the next several years helps place individual wells into a broader financial context.
Tools like MVestimate, which provide an estimated value of minerals over the next six years based on production trends, can help mineral owners move beyond isolated well analysis and better understand long-term asset performance.
How Better Data Visibility Improves Forecast Understanding
Improved access to structured data allows mineral owners to interpret oil and gas production forecasting with greater clarity and confidence. When data is complete and well-organized, forecasting becomes more practical and actionable.
Clear View of Historical and Current Production
Access to both past production data and ongoing activity provides a more accurate understanding of how a well is evolving over time. This continuity helps align expectations with actual performance.
Visualization of Field Activity and Well Locations
Mapping tools that display well locations and drilling patterns help place production data into context. Understanding how wells are positioned within a field makes it easier to interpret variations in performance.
Use of Forward-Looking Analytical Tools
Forecast-based analytical tools provide estimates of future production based on historical trends. These insights allow mineral owners to evaluate different scenarios instead of relying solely on static reports.
Integrated Data for Better Decision-Making
Platforms that combine production data, geographic insights, and forecasting models create a more complete view of asset performance. This integration reduces uncertainty and supports more informed decisions.
The Growing Role of Technology in Oil and Gas Production Forecasting
Advancements in technology have significantly improved how oil and gas production forecasting is performed and applied. These developments are making forecasting more dynamic, accurate, and accessible.
Integration of Real-Time Data Systems
Modern platforms incorporate real-time production data, allowing forecasts to be updated continuously. This reduces delays between data reporting and analysis, improving responsiveness to field conditions.
Enhanced Accuracy Through Data Analytics
Advanced analytical tools process large volumes of production data to refine forecasting models. These systems help identify trends that may not be immediately visible through traditional methods.
Machine Learning for Pattern Recognition
Machine learning models analyze data across multiple wells to detect patterns and improve forecast reliability, particularly in unconventional reservoirs. These models complement traditional engineering approaches.
Greater Accessibility for Mineral Owners
Technology has made forecasting more accessible beyond engineering teams. With the right tools, mineral owners can now engage more directly with production data and better understand forecast implications.
In addition to production analysis, some platforms also provide indicators of future development activity. For example, features such as New Well Probability assign a percentage likelihood of drilling in a given area, where a higher percentage reflects a stronger likelihood of future well development. This type of forward-looking insight helps mineral owners connect forecasting with potential future activity, not just existing production.
Final Thoughts
Oil and gas production forecasting helps mineral owners understand how a well is likely to perform over time and what that means for royalties, leases, and long-term value. While forecasts are not exact predictions, they provide a practical way to evaluate production trends, risks, and future income potential with better clarity.
Mineral View Features support this process by combining production data, map-based insights, and tools like Know Your Operator, Lease Report, and more in one place. This makes it easier for mineral owners to interpret oil and gas production forecasting and make informed decisions with confidence.